Troubleshoot with your Browser's Developer Tools
Caution: this content was last updated over 3 years ago
Quite often, the first place you will notice that something is wrong is when you visit a page on your site. A good place to start, therefore, are the developer tools that are built into your web browser.
This article contains two kinds of content:
- General pointers to things ‘under the hood’ that can be very useful when trying to diagnose a problem
- Advice for specific problems a developer may encounter
Note that for the purposes of this article, I’m going to be using Chrome’s developer tools (also known as Chrome DevTools), but other browsers have similar functions. It is recommended that you familiarize yourself with those tools before using them; for example, you may wish to refer to the documentation.
Note that a number of code snippets in this article will teach you how to directly access objects and global variables. These can be used for debugging purposes, but should not be used in production code.
Using the JavaScript Console to Analyze the Global SC Variable
To open the console, open the tools (press Command+Option+I (Mac) or Control+Shift+I (Windows, Linux)) and then click on the Console tab.
We don't typically use global variables, but we have one that runs on every site: SC. If you type SC into the console, it'll return a number of objects.
You can click through each one and see data and settings about the current state of the site as your current user. Some of these things will be context specific, which means that they will be affected by your current user (or if you're not logged in at all) and what page you're currently on, and some will be global.
Use the Environment Object to Check Site Settings
A good place to start is with some site settings. We make them available as properties to the ENVIRONMENT object attached to SC. To access it, you can type in SC.ENVIRONMENT.
From there, you can do something like this to access site settings:
SC.ENVIRONMENT.siteSettings
Remember, this is case-sensitive.
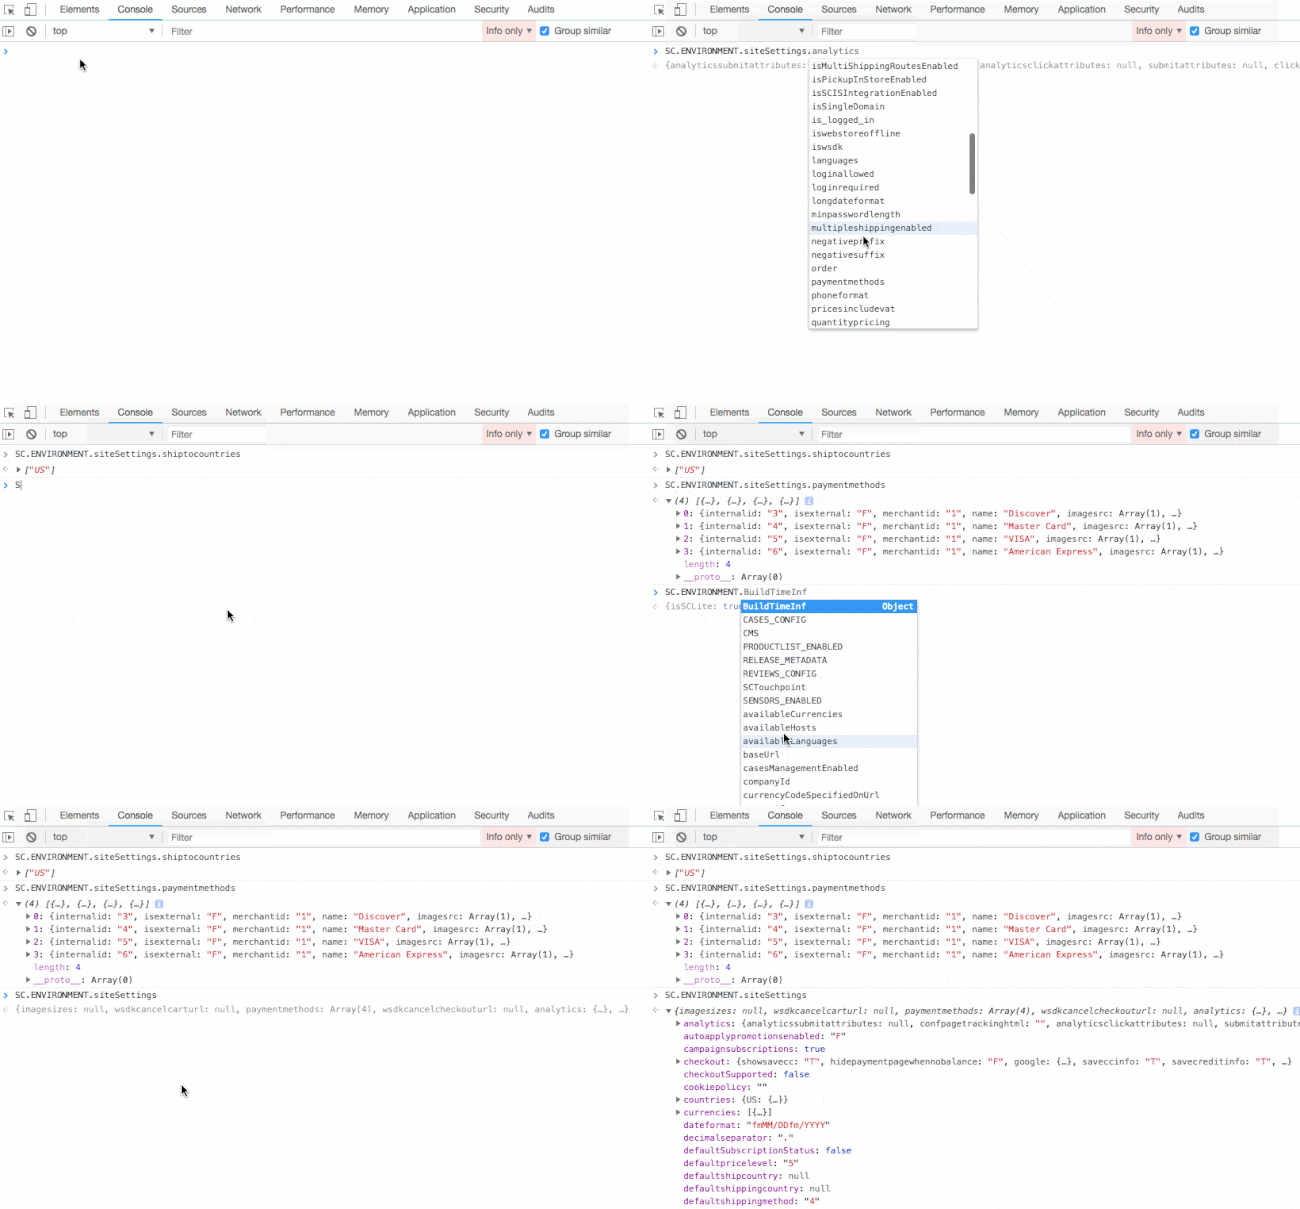
One interesting thing about DevTools is that it will 'eagerly' evaluate what you type in, to show you the results of functions, the available properties of an object, and the values of those properties. You can see in the above gif how you might check the values of certain site settings.
Get the Site Configuration
Another common issue is that you make a change to a site's configuration record, but it doesn't seem to be affecting the frontend of the website. Is the value making it to the frontend? Is it being cached in your browser? You can find out by querying the configuration object.
SC.CONFIGURATION
From there, you can access a number of properties, just like you could with the ENVIRONMENT object:
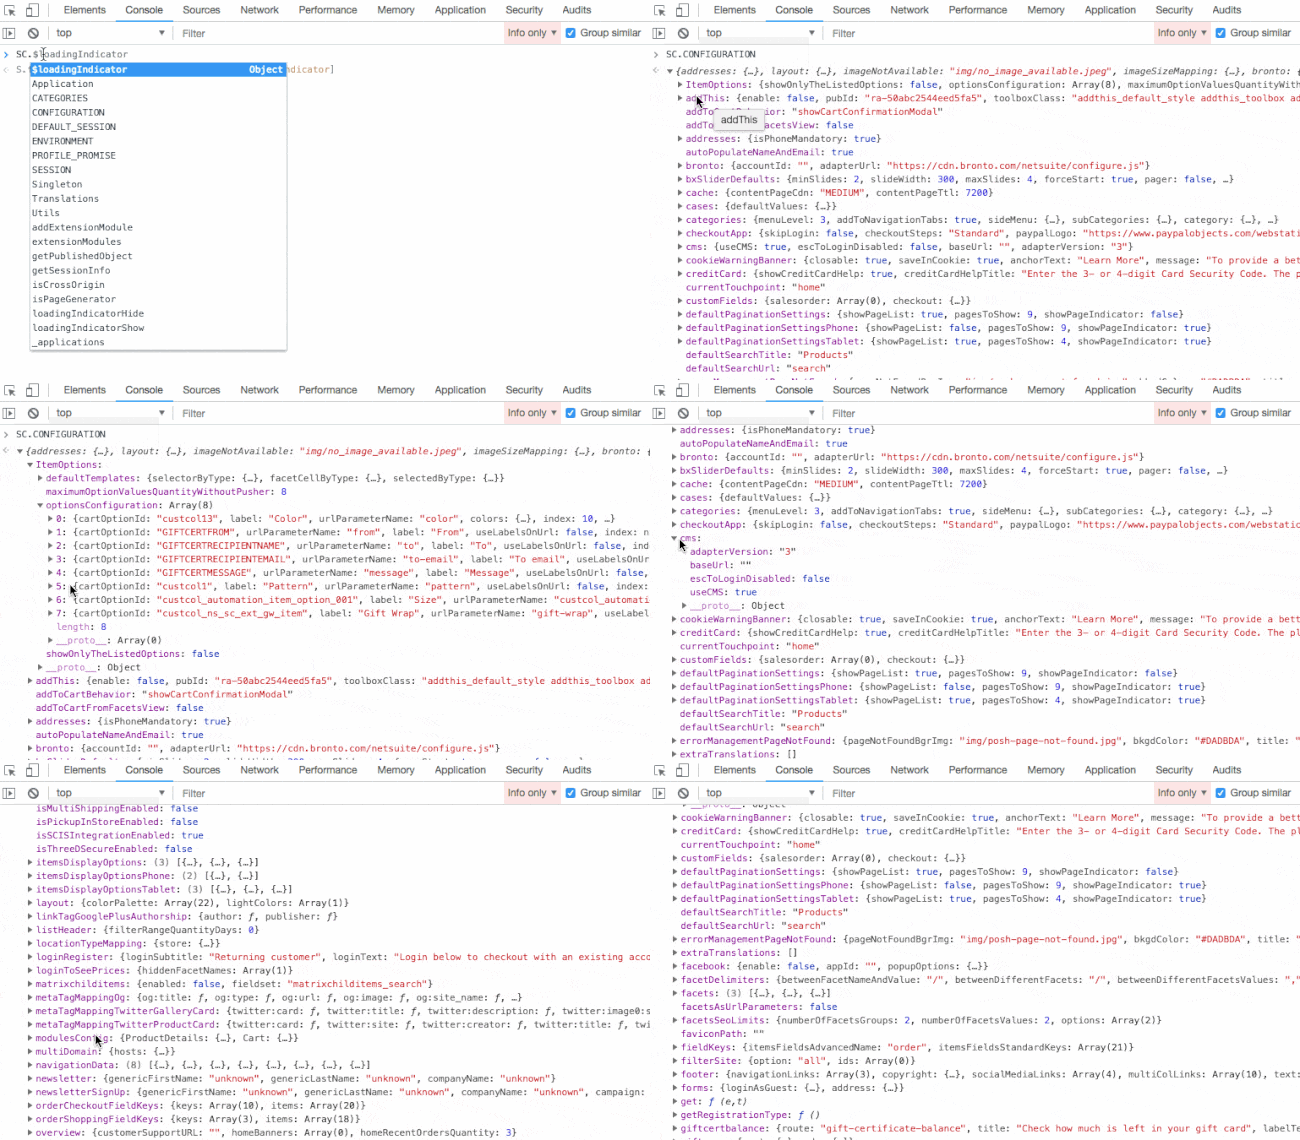
Now you can look for the configuration value and see if it's coming through to the frontend.
Access the Main Parent View
The main parent view (or the ‘layout view’) is the main container view for the page you are currently looking at. For example, if you are the homepage you will be accessing an instance of Home.View; if you are on a search results page, you will be accessing an instance of Facets.Browse.View.
// Newer sites
SC.Application('Shopping').getLayout().getCurrentView()

// Older sites
SC._applications.Shopping._layoutInstance.currentView
In this example (and future examples) you can substitute Shopping for the name of the application (eg MyAccount or Checkout).
Accessing an instance of a view is useful because it shows how the page is being rendered in actuality, rather than the specification based on the JavaScript/TypeScript file.
Bonus tip: you can check if a view (or any object) is an instanced version of a module by requiring the module and comparing them.
For example:
SC.Application('Shopping').getLayout().getCurrentView() instanceof require('Facets.Browse.View')
This will return true if you are currently on a product list page.
Get the Current Model
Common customizations to web stores involve adding extra data to the model before it's sent to the view and then to the template. If your data, such as a custom field, doesn't show up on the frontend, it can be tricky to figure out what exactly is the problem.
One thing you can do is check the model and see if the data has been sent from NetSuite to your site's frontend. Type in:
// Newer sites
SC.Application('Shopping').getLayout().getCurrentView().model

// Older sites
SC._applications.Shopping._layoutInstance.currentView.model.attributes
Depending on where you are, you'll see different things. If you're on a product detail page, you can click on item > attributes to see if the field is there. If you're on a product list or search results page, you can click on items > models and then find the specific item in the array.
Bonus tip: if it's not there, make sure you've updated the relevant field set and refreshed your search index!
List All Loaded Files
Now we're getting a bit more advanced.
When you use define() in your code, you're creating a new class in your application. If it's included in your compiled JavaScript, then it will have a 'definition' and will be made available to be called by the application.
You might sometimes get an error where it says something like:
Uncaught Error: No MyCustomization.View
Where MyCustomization.View is the name of a class you've tried to call in your code. In simple terms, it returns this if it hasn't been loaded by RequireJS, the library we use for managing dependencies. You can get a full list of every file loaded into the application by typing in:
requirejs._defined
This will return everything that is currently loaded into the application. Of course, you might get other areas where you suspect that the problem is because the file has not been loaded into the application.
Log a View's Context Object to the Console
The getContext() method returns an object of data that the template is going to render. If text isn't showing, or conditionals aren't returning the correct values, then it's possible that they're not receiving the correct values.
We've touched on accessing the application, layout and view objects in passing, and another part of that is accessing their context objects:
// Get the context object for the current parent view
SC._applications.Shopping._layoutInstance.currentView.getContext()

// Get the context object of a specific child view in modern versions of SC/SCA
SC._applications.Shopping._layoutInstance.currentView.childViewInstances['Product.Price']['Product.Price'].childViewInstance.getContext()

// Get the context object of a specific child view in older versions of SCA
SC._applications.Shopping._layoutInstance.currentView.childViewInstances['Item.Price'].getContext()
The childViewInstances will return the actual child views that have been constructed. You can use childViews instead to return the views that are listed in the parent file itself (ie pre-construction).
Access Extensibility API Components
These tips only apply if you're using SuiteCommerce, or SCA Aconcagua or newer (2018.1+).
Make a Simple Change with a Component
When you're coding, you typically access the components from an argument available from the mountToApp function in an entry point file. However, you can also access them through the JavaScript console by accessing the same object we used for the model. For example, if I wanted to test out some code using the PDP component, I can use:
var PDP = SC.Application('Shopping').getComponent('PDP')
I'm using SC.Application('Shopping') instead of SC._applications.Shopping to make a point (the old way will still work). In newer versions of SuiteCommerce Advanced, we obviously discourage the access of private methods/functions/objects and instead the encourage the use of our API. While we're only using this method for testing, I just wanted to point this out so that you're aware. There are a number of other examples where this is the case; for example, we might use getLayout() instead of _layoutInstance. Remember: we recommend the use of our best practices because they're stable; the use of private methods is not recommended.
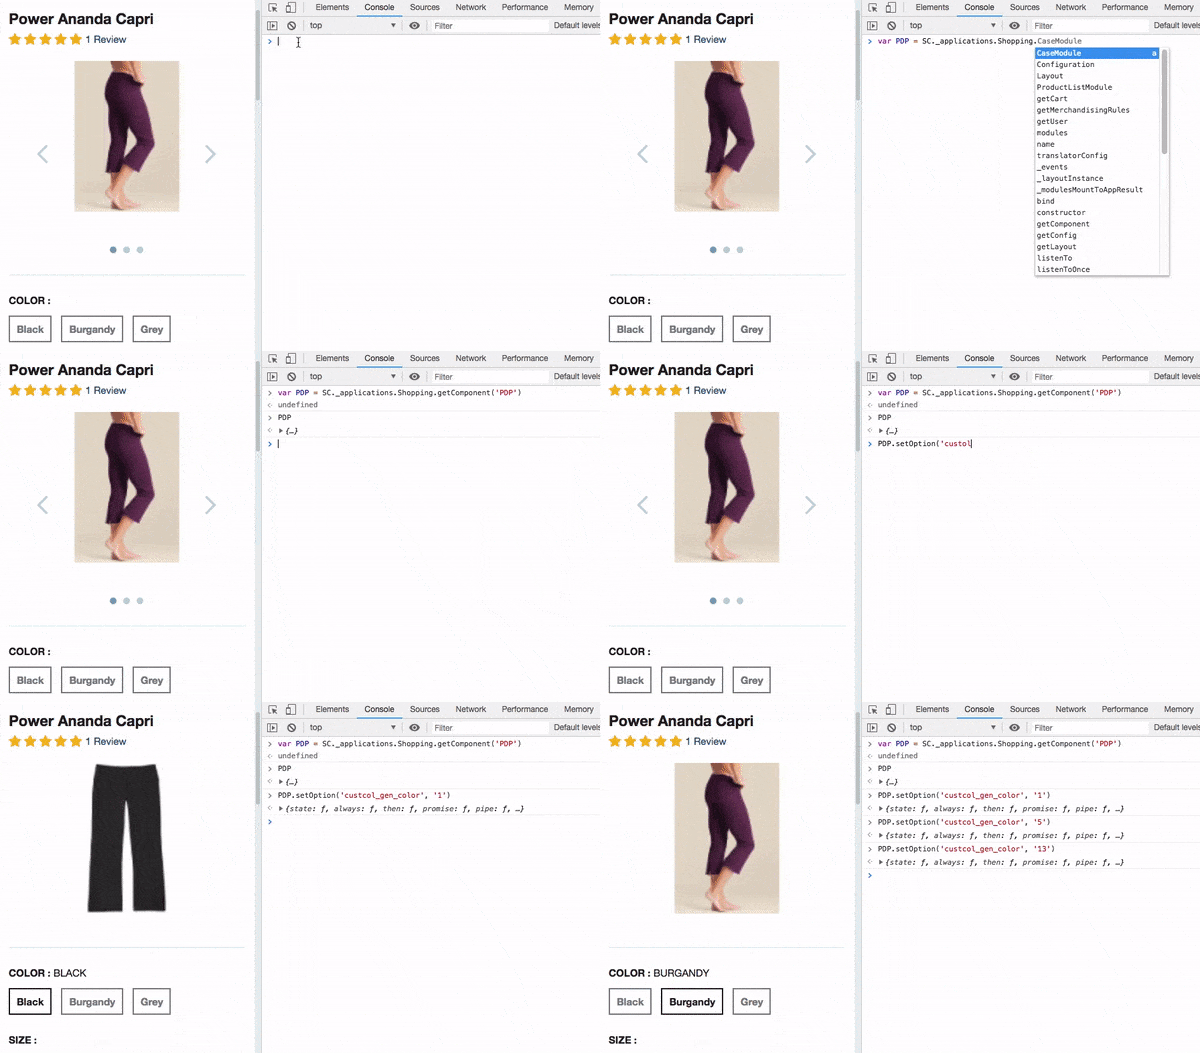
Anyway, back on track and looking at the code example, this will make the PDP component available as PDP in my console (assuming, of course, that you are on a product detail page — some components such as the PDP, PLP and checkout only work when you're in those contexts). From there, you can use all of its available methods to quickly test out changes. For example, if I wanted to try out changing the selected color option of a matrix item on a PDP, I could use:
var PDP = SC.Application('Shopping').getComponent('PDP')
PDP.setOption('custcol_gen_color', '1')
The values you'll enter on your site will depend on your site's custom fields, setup and the item you're viewing.
Test a New Child View
Let's say you've created a new view and template and they don't seem to be working correctly. You've checked and they're being loaded into the application (see above), so you just want to add them to your current page and see how they will look. How do you do this?
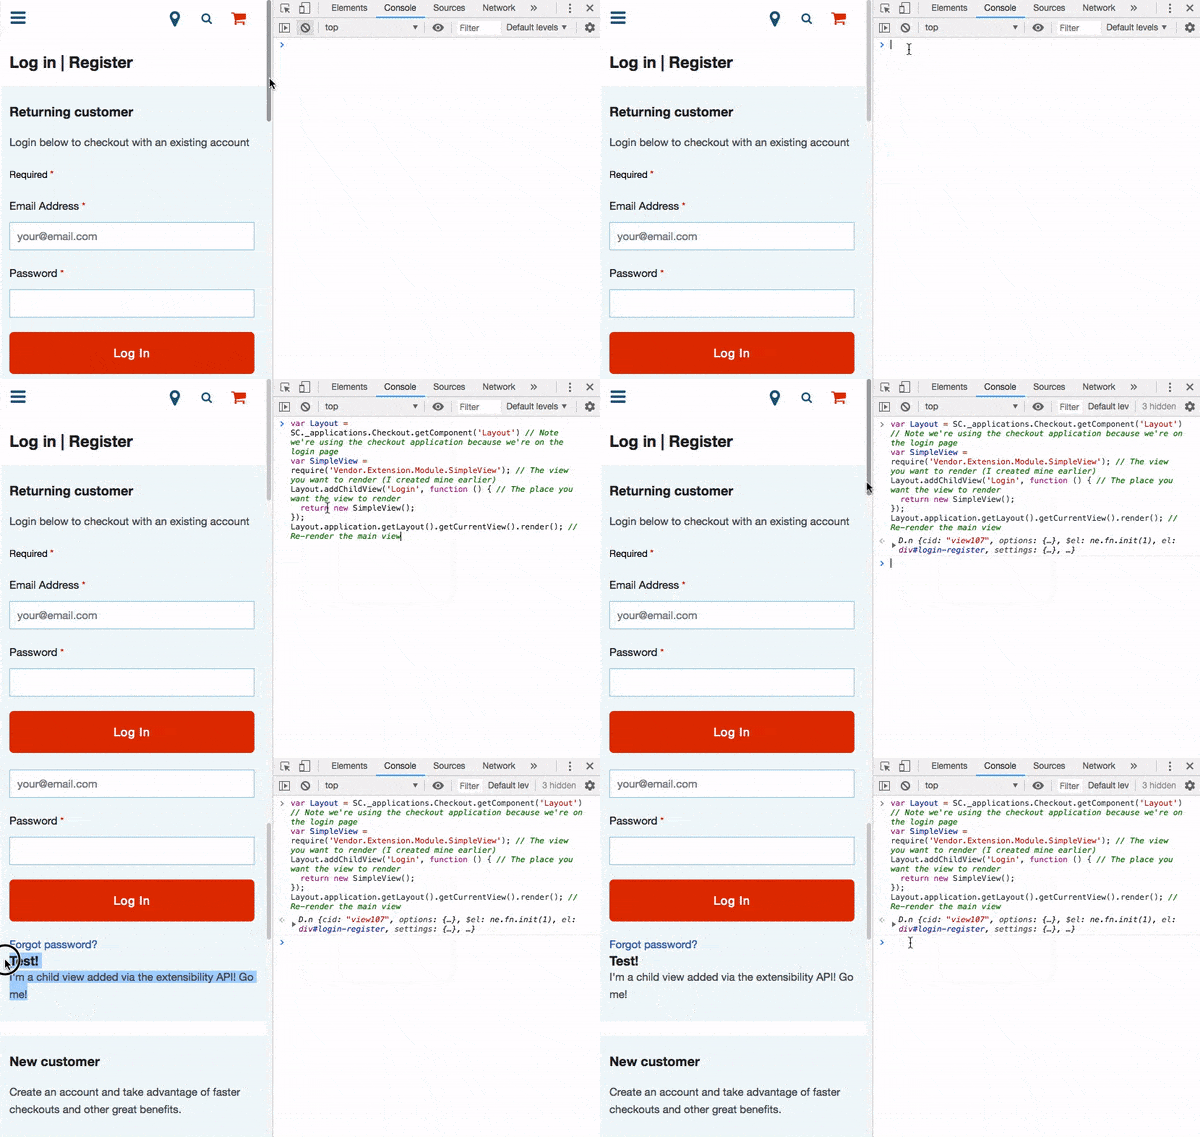
In this example, I've already created the view and template and I want to load it into my login page. You can also do this through the console, including re-rendering the main view so that it shows in the page.
In my example, I'm going to be adding this to the login page.
How do we do this?
Here's the view:
define('Vendor.Extension.Module.SimpleView'
, [
    'vendor_extension_module_simple.tpl'
  ]
, function
  (
    vendor_extension_module_simple_tpl
  )
{
  'use strict';


  return Backbone.View.extend({
    template: vendor_extension_module_simple_tpl

  , getContext: function getContext ()
    {
      return {
        message: 'I\'m a child view added via the extensibility API! Go me!'
      }
    }
  })
})
And here's the template:
<h2>Test!</h2>
<p>{{message}}</p>
After adding these to an extension, I can use the these console commands:
var Layout = SC.Application('Checkout').getComponent('Layout') // Note we're using the checkout application because we're on the login page
var SimpleView = require('Vendor.Extension.Module.SimpleView'); // The view you want to render (I created mine earlier)
Layout.addChildView('Login', function () { // The place you want the view to render
  return new SimpleView();
});
Layout.application.getLayout().getCurrentView().render(); // Re-render the main view
After calling the layout component (on the checkout application because we're on the login page), we create a version of the view we want to render by using require() and passing it its class name. This is essentially what happens when you pass class names in a define() statement, listing your dependencies — ie, "load this file".
Then we use addChildView() to add the view to the place where we want to render it, and then re-render the main view. The getLayout() method gets the current layout, which is the skeleton of the application, and then we call getCurrentView() to call the main view currently being used. Then we just re-render it.
Bonus tip: while I don't think it's going to be useful, you can create a confirmation dialog or modal in the console too!
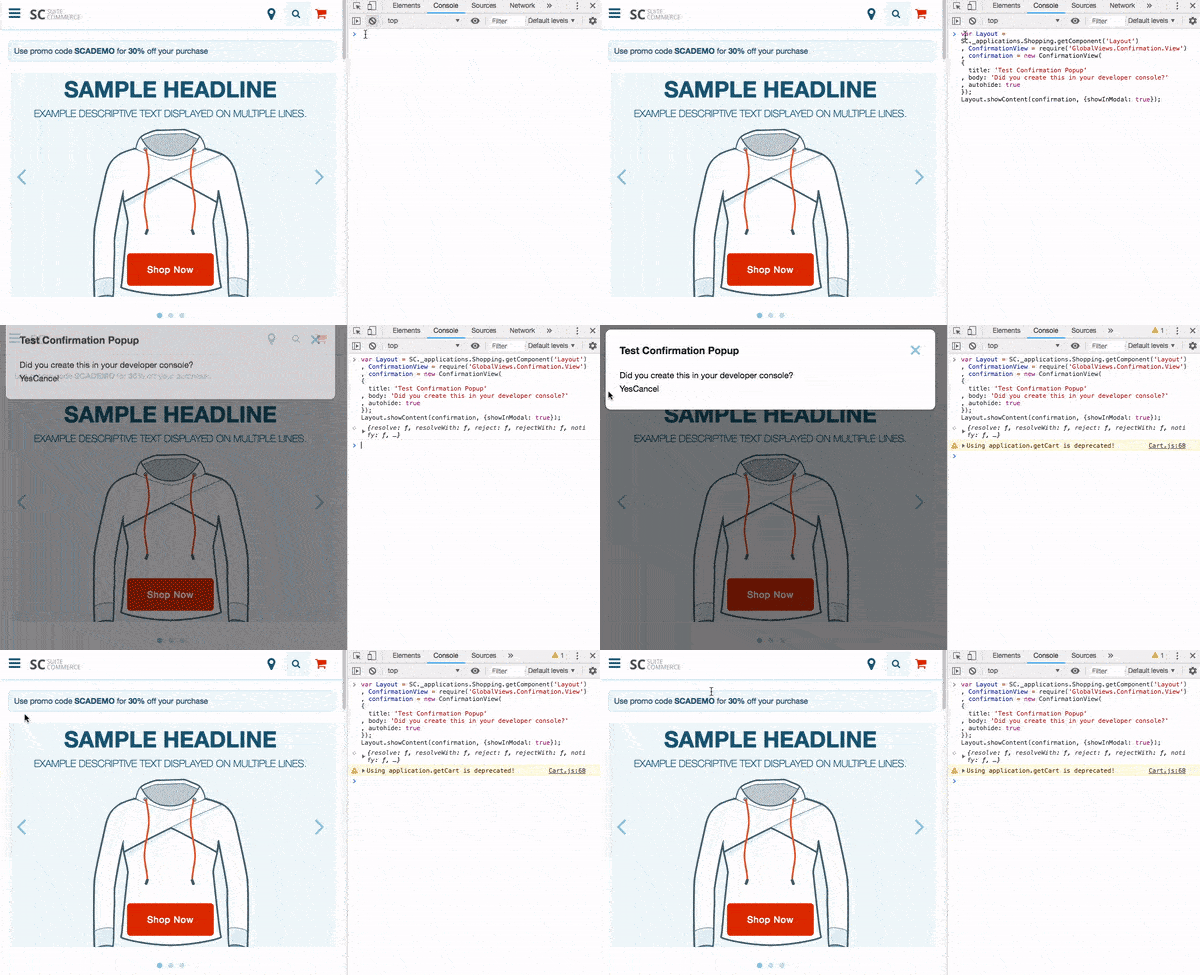
How do we do this?
var Layout = SC.Application('Shopping').getComponent('Layout')
, ConfirmationView = require('GlobalViews.Confirmation.View')
, confirmation = new ConfirmationView(
  {
    title: 'Test Confirmation Popup'
  , body: 'Did you create this in your developer console?'
  , autohide: true
  });
Layout.showContent(confirmation, {showInModal: true});
Like before, we are creating variables for the layout component and our confirmation view. Then we create a final one, creating a new instance of the confirmation view with our test properties.
To create it, we use the familiar showContent() method, which is used to render views. You'll note that after passing it our newly constructed view, we also pass an object of options; specifically, we passed it showInModal: true, which tells it to create it in the modal.
See Show Content in a Modal for more information on confirmation dialogs.
Use the Network Tab to Analyze Requests
We've spent a lot of time looking at the JavaScript console, and there's still plenty of interesting things to play around with in there, but let's move onto another useful aspect of the developer tools: the network tab.
As long as you have the developer tools open, all HTTP requests will be logged in it (requests made before you opened the tools are not logged).
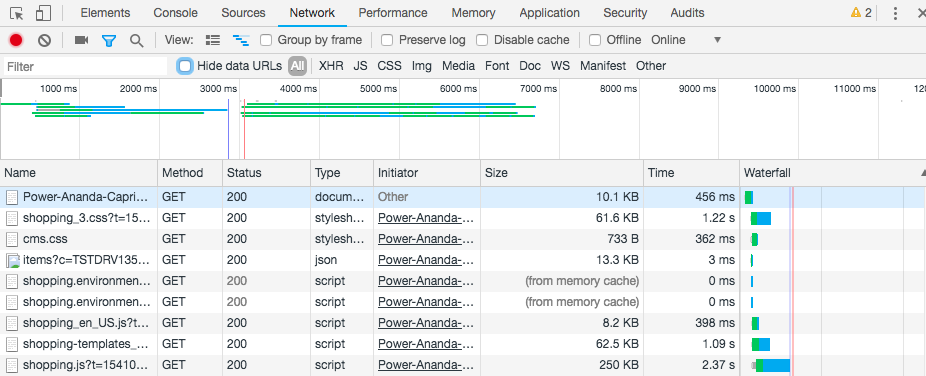
All kinds of requests are logged by the tools, and you can filter them by clicking on the specific buttons (eg, XHR, JS, CSS, images, etc).
If you filter by XHR (XMLHttpRequests — eg, AJAX requests to the items API) and then click one of the requests you will be shown the specific details of the request being made. This is particularly valuable
To debug issues in the applications, we will typically use the Headers and Preview sub-tabs. The HTTP headers are the bits of information about the request being made as well as any additional information that might be required. By inspecting the headers, you can see the basics of your requests, such as the query string parameters, which are the bits of data at the end of a URL. For example, the request URL for the items API is api/items/ and everything else included afterwards are the specifics of the request, such as the item URL we want (or keyword for searching), as well as information such as currency and country.
To review the response from the server, we can use the Response sub-tab, but we prefer the Preview tab because it formats JSON responses so they can be clicked through and explored more easily.

This can be quite useful for troubleshooting search results. If you ever wonder what data is being returned from the API after performing a keyword search, or when a shopper hits a commerce category, you can right-click on the XHR and then click on Open in a new tab to get a full-screen look at the API results.
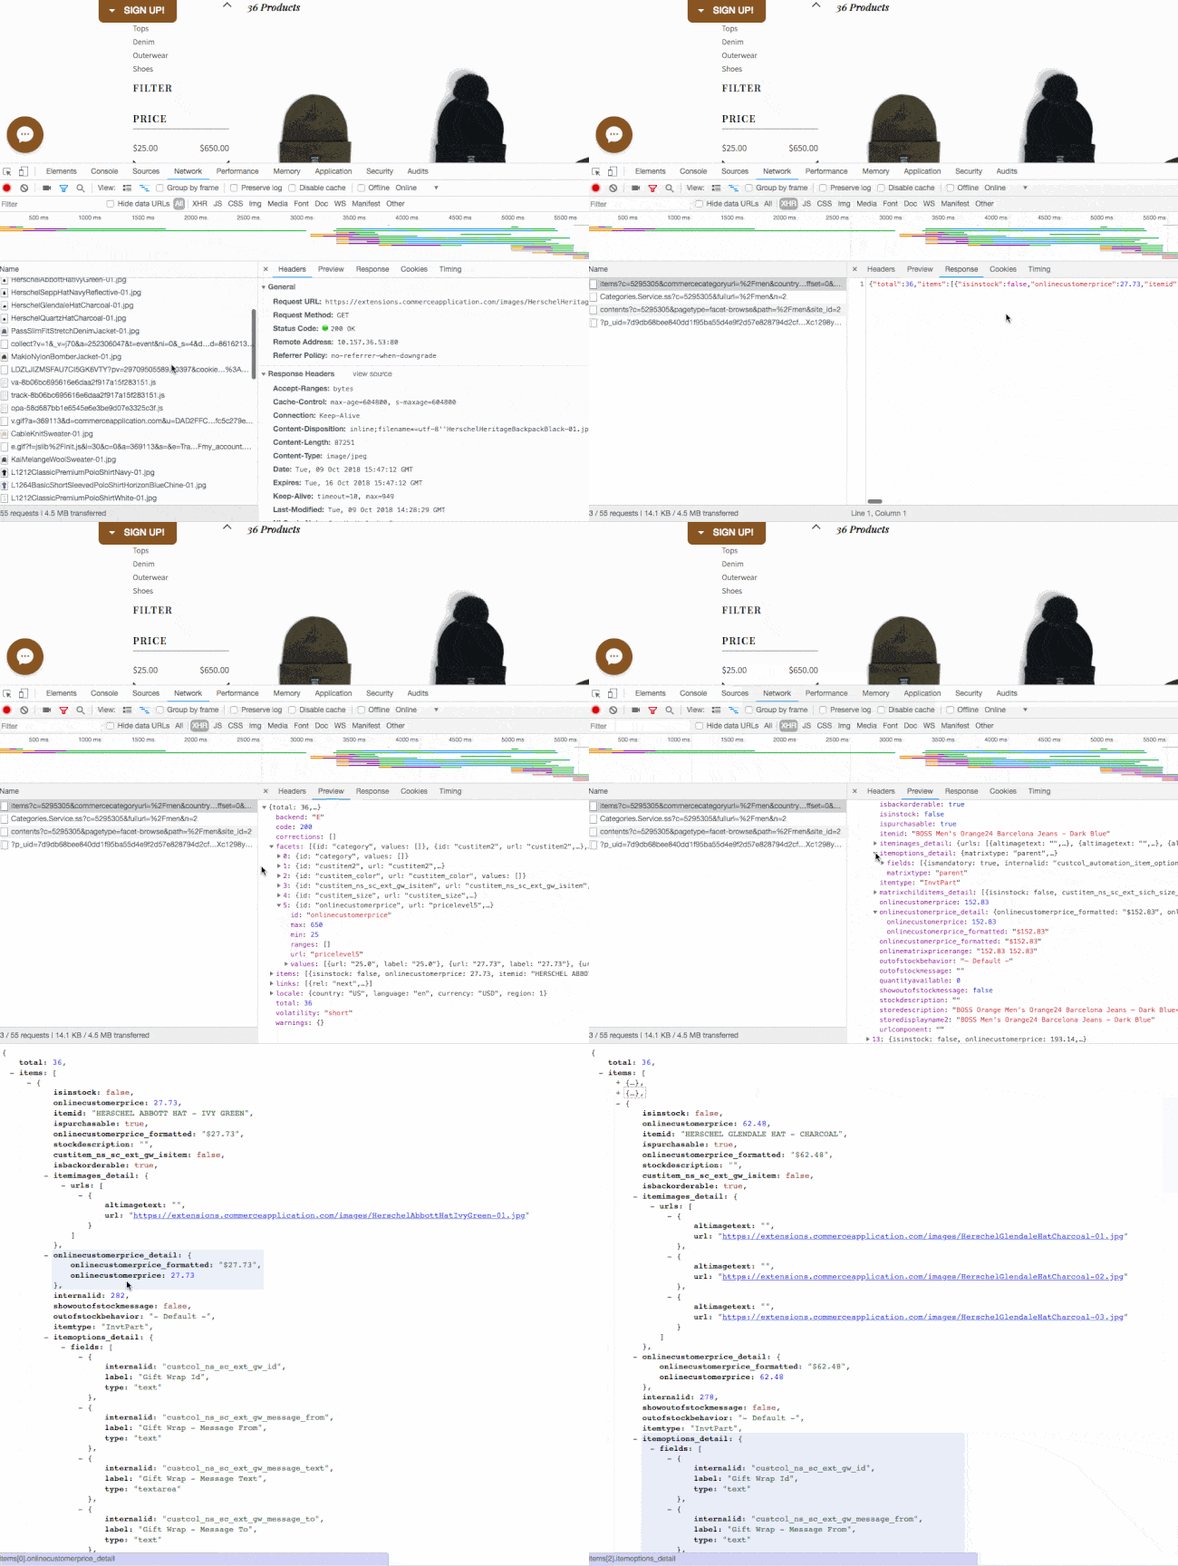
The above gif shows a developer clicking through a sample XHR. Note that when the API response was opened in a new tab, there was a brief moment when it was unformatted and then formatted — this is a plugin that formats JSON responses and there are many available in the Chrome web store.
Any service that is called by an application can be inspected to see the request/response, not just the items API. Important services to check include LiveOrder.Service.ss (the XHR for the cart) and Categories.Service.ss (the XHR for commerce categories). As with the checking with did earlier with JavaScript console, you can check the API/service responses to see if the correct data is being sent and if the correct data is being returned.
Use the Network Tab to Analyze Performance
There are a lot of resources on this site that cover how to analyze performance problems, so we won't go into too much detail about this.
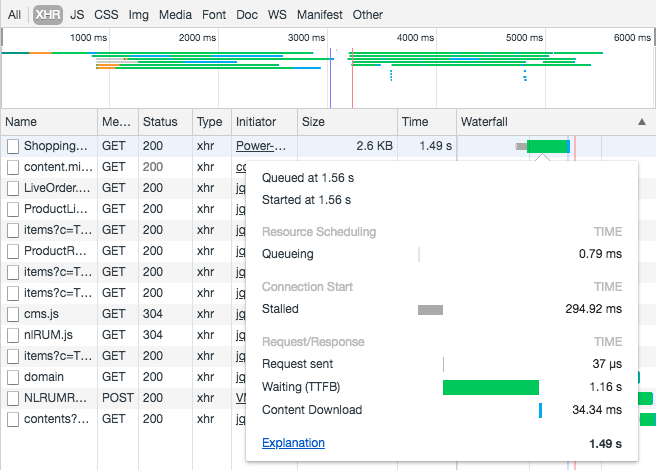
However, something worth reiterating is that performance is important. Search engines prefer faster sites, and so do shoppers. Very slow sites can be problematic and you can get simple stats from the developer tools.
For more information, see our performance guidelines.
Check Site Metadata
Every time a page is rendered on a SuiteCommerce web store, some metadata will be printed at the bottom of the body tag. Generally speaking, it is not particularly valuable but can be useful in getting information on how quickly the page took to generate and getting exact version information.
Here is an example:
<!-- SuiteCommerce Advanced [ prodbundle_id "333161" ] [ baselabel "SCA_2020.2.0" ] [ version "2020.2.0" ] [ datelabel "2019.00.00" ] [ buildno "0" ] -->
<!-- 775 s: 45% #173 cache: 1% #26 -->
<!-- Host [ sh24.prod.sv ] App Version [ 2020.2.0.78 ] -->
<!-- COMPID [ TSTDRV123456 ] URL [ /s.nl ] Time [ Thu Nov 19 07:09:14 PST 2020 ] -->
<!-- Not logging slowest SQL -->
The first line will list the specific web store application that is being used. This is followed by the specific bundle ID and then some version numbers. This can be useful if you don’t know which product is being served, or are unsure about specific version numbers.
The second line is performance information. The first number is the time it took in milliseconds to generate the page and is the single biggest contributor to the ‘time to first byte’ (TTFB) metric. The lower these numbers are, the better the page is performing:
s: nn% #mmmdescribes how many database resources were usednnis the percentage of the page time spent accessing Oraclemmmis the number of Oracle queries made
cache: nn% #mmmdescribes how many distributed cache resources were usednnis the percentage of the page time spent accessing the cache infrastructuremmmis the number of cache requests made
The third line indicates the specific server, which is not important, but it does list the version of the NetSuite application running the web store. This can be useful in troubleshooting whether a particular backend feature is available to the web store, or if you need to compare how a particular web store works on different backend versions.
The fourth line lists the account number of the application running the web store, the URL the handled the request, and the time the page was generated.
Finally, there is an SQL debug comment that will almost always show the same message. You can ignore this as we sometimes use it for internal testing.
Troubleshooting Specific Problems
I See a Blank Page When I Visit a Secure Part of My Local Site
This is probably an issue you'll notice when you first start developing or if you've just opened your local server in a new tab/window. As you're viewing a secure page but loading scripts through an insecure protocol (eg, http://localhost:7777/javascript/...), your browser will block them unless you add an exception. In Chrome, this can be overridden by clicking the silver shield in the address bar and then Load unsafe scripts.

This may not always result in a blank page, but you may notice "Mixed Content" errors if a script has been blocked.
I Reloaded the Page But the Content Hasn’t Changed
Clear Caches
The most likely culprit will be caching. Caching occurs at numerous stages throughout your site including in your browser and on our servers. To check whether the issue is your browser, empty the cache and hard reload.
To do this in Chrome, have the developer tools open and click-and-hold on the Reload icon, then select Empty Cache and Hard Reload. This will ensure all stored resources are cleared and requested fresh again.
If this is a site hosted on NetSuite (as opposed to one you’re serving locally) then you should also submit a cache invalidation request for the domain (or specific paths) via the NetSuite application.
Check for Errors in the Console
The developer console should return any errors with your site’s JavaScript. Check to see if a resource has failed to load (perhaps there’s a typo?) or if there are syntax errors.
You can also use the debugger command in your JavaScript to create breakpoints in your JavaScript, or console.log() to send messages, at various points in your code’s execution.
I Don’t Think the Call to My Service File is Working
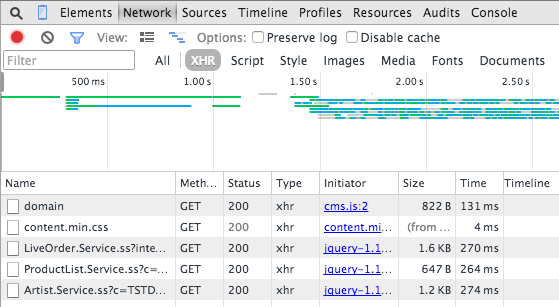
When you're trying to connect the frontend of your site with the backend, you may experience difficulties in getting / creating / updating / deleting data on the server. You can use your browser's Network tab to view all network operations, such as the getting of files.
If you filter for XHR (XMLHttpRequest requests) after performing your CRUD operation, you'll see a small selection of requests that have been made to the server. You should see the name of the service being used, the appropriate method and the correct status. Following that you can dive deeper by examining the Preview or Response, which will show the payload of the operation (such as JSON data of a GET).
What Template Do I Need to Edit?
If you want to make an aesthetic change to your site or close in on a bug in a template, you may find it difficult to find the right template to edit. The first place to start is to inspect the page that you want to change. Then, go through the DOM elements until you find a comment that begins "TEMPLATE STARTS". This will have the name of the template being rendered by a view.
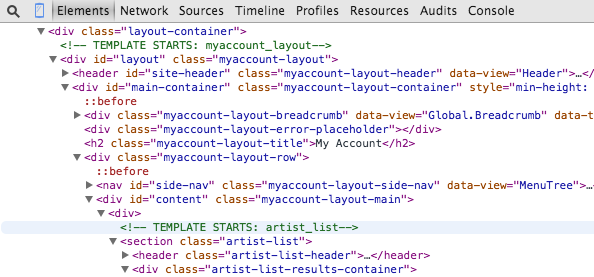
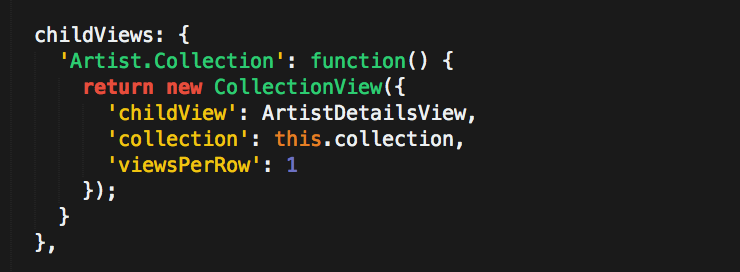
Note, however, that the template may use other templates within it if, for example, the main template shows a list and another template is used to show each item in that list. To do this, Backbone uses a child view as part of a collection view. A key characteristic to look out for is the use of the data-view parameter on elements within the template; these are used to load in additional templates from the collection. Once you have that name you can look in the view that calls the template and then look at the childViews function. With that name you can reference the view and, in that, the template that's being used.
Code samples are licensed under the Universal Permissive License (UPL), and may rely on Third-Party Licenses